


Liquidation Hunting in the Crypto Market
In crypto trading circles, there’s a persistent myth that traders can easily access information about price levels where mass liquidations of leveraged positions will occur. Many active market participants seem convinced that these zones act as “magnets” for price action. According to this belief, if, for example, a large number of long positions are set to be liquidated at $90,000, then whales — or even exchanges themselves — will push the price toward that level to “collect stop-losses” and “strip retail traders of their money.”
Liquidation heatmaps, compiled by analytics platforms like Coinglass, appear to offer insights into these so-called magnet zones. Here’s an example of such a map as of April 27, 2025:
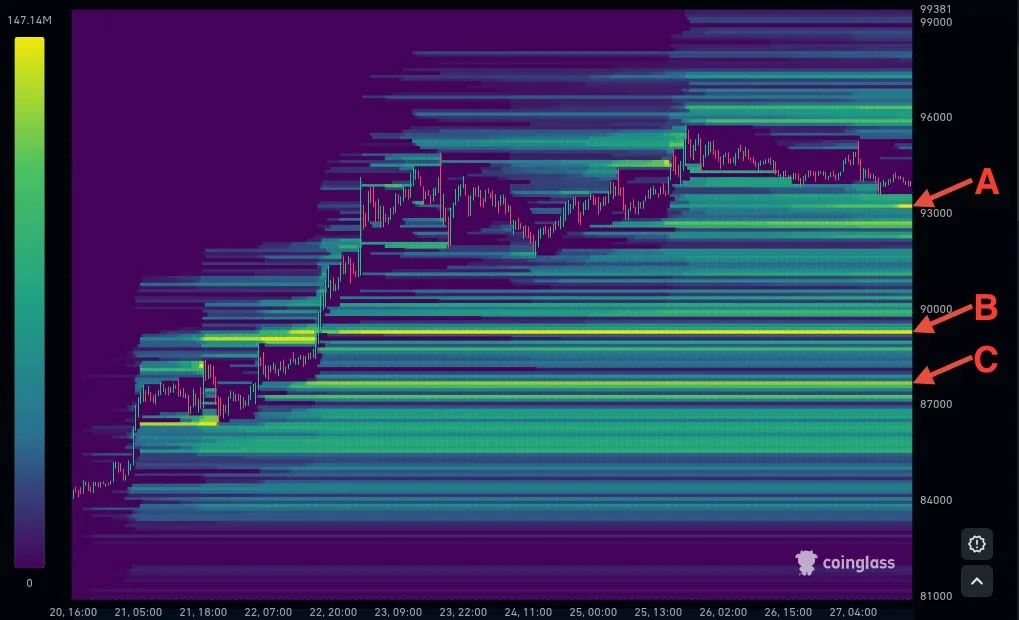
The bright yellow stripes on the heatmap highlight price levels where mass liquidations are expected. On today’s chart, we can spot such zones slightly above $93,000 (A), just below $90,000 (B), and slightly above $87,000 (C). Zone A is based on recently opened positions from just a few hours ago, while zones B and C reflect positions that have been held for about five days.
The scale on the left shows the volume of potential liquidations corresponding to each color, with the brightest yellow line representing an expected liquidation volume of $147.14 million.
Some traders use these heatmaps as predictive tools, reasoning that whales and exchanges have an incentive to push the Bitcoin price toward these clusters of liquidation. But is liquidation hunting really possible — and can liquidation maps reliably point to the levels where prices are likely to be drawn?
Let’s dive deeper into how liquidation hunting works — and whether it’s a myth, an opportunity, or something in between.
Why Liquidation Hunting Can Make Sense
Let’s imagine a simple scenario involving Alice and Bob.
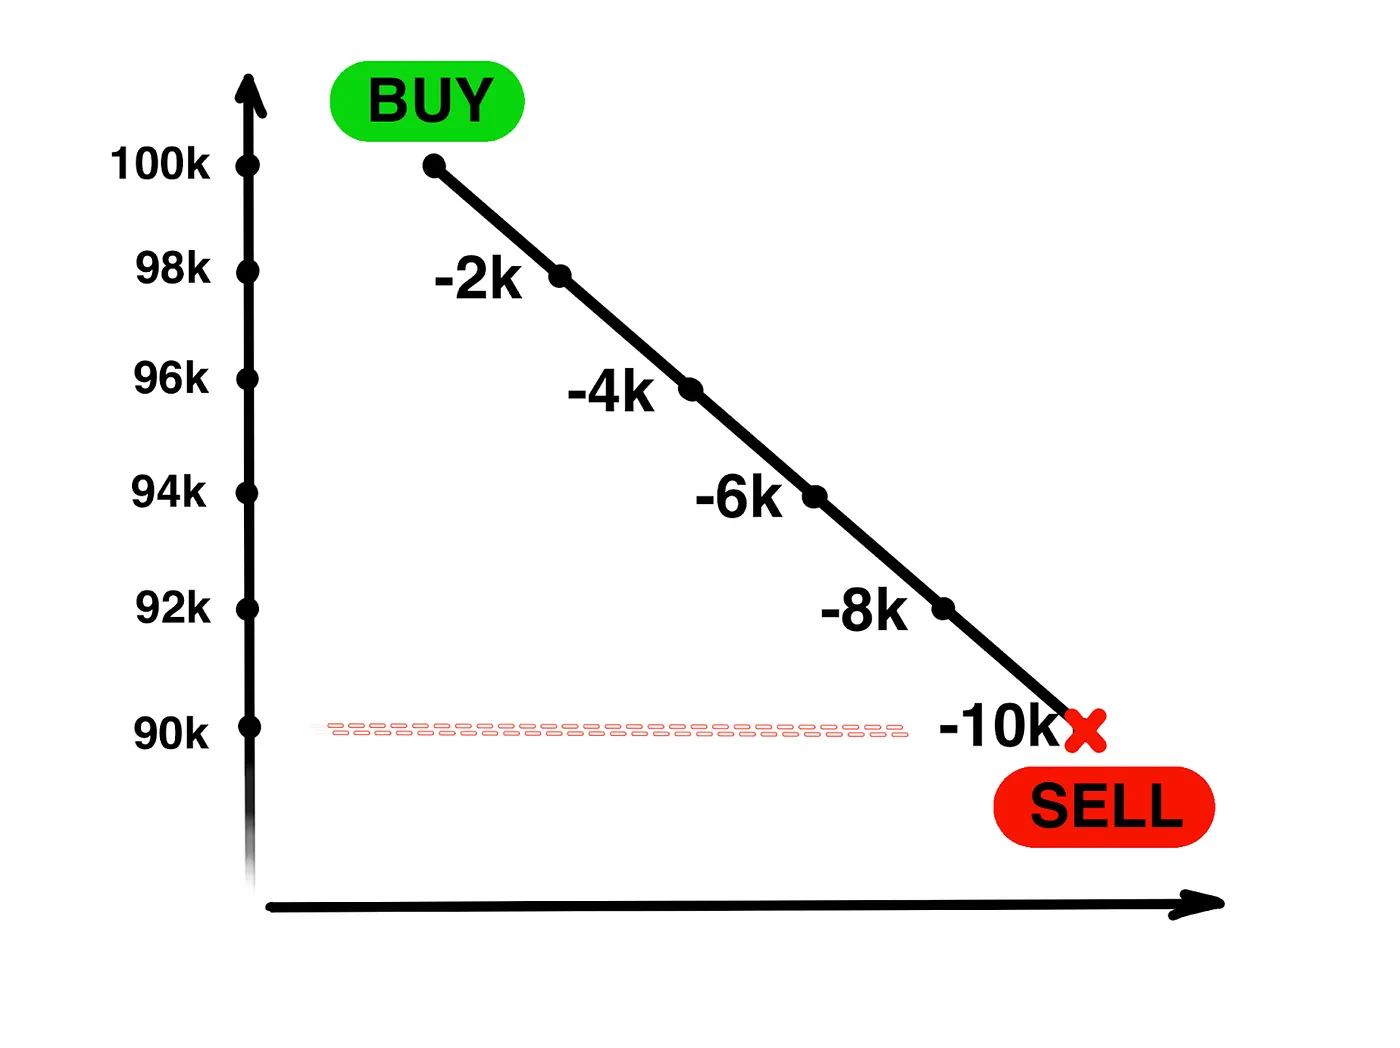
Alice opens a long position for 1 BTC at $100,000 on a crypto exchange, but she only posts $10,000 as collateral. (Which is understandable — many of us would hesitate to entrust a full $100,000 to any exchange!) Now, Bob happens to know about Alice’s position — and he has enough capital at his disposal to move the market if needed.
Every time Bitcoin’s price drops by $1,000, Alice’s position loses $1,000 in value. Since she only has $10,000 in collateral, a $10,000 drop would wipe it out completely. At that point, the exchange would automatically trigger a forced sell order to liquidate her position. That’s what liquidation means: her long would be closed at market price.
Why would this be attractive to Bob? Because he knows that if Bitcoin hits $90,000, Alice must sell, no matter what. And that guarantees Bob the opportunity to buy Bitcoin cheaper than the current market price.
In other words, it’s easy money:
- Place a limit buy order at $90,000.
- Execute a large market sell order to push the price down to $90,000.
- As Bitcoin hits $90,000, the exchange liquidates Alice’s position with a market sell order — and Bob’s limit buy order gets filled.
Effectively, Bob sells high, forces the price lower, and buys back at a discount — all thanks to triggering someone else’s liquidation. That’s the basic logic behind liquidation hunting.
What Happens to Price When It Hits a Liquidation Zone
Traders who base their strategies on liquidation heatmaps often view mass liquidation zones as “magnets” for price action — natural targets that the market is drawn toward. For instance, if Bitcoin is currently trading at $94,000 and a major liquidation cluster lies around $90,000, it would seem logical to expect that large players might push the price down toward $90,000.
Following this logic, if you’re holding USDT and planning to exchange it for BTC, it might seem wise to wait. Instead of buying now at $94,000, it would be better to wait for the price to fall toward the $90,000 liquidation zone. After all, the “whale” (the liquidation hunter) is expected to buy there too, and once the pressure is lifted, the price should bounce back to higher levels — right?
But can you really be sure the whale will start buying at exactly $90,000?
In the earlier example, Bob had a limit order waiting at $90,000. But what if he didn’t? Here’s what could happen instead:
- The exchange liquidates Alice’s position with a market sell order, pushing the price even lower.
- That drop triggers liquidations of other traders’ positions at slightly lower levels.
- Each new liquidation adds more selling pressure, pushing the price down further.
- And so on, creating a cascading effect.
In other words, a whale might allow a cascade of liquidations to happen — buying much cheaper only after forced selling has exhausted itself. Of course, other buyers could step in earlier, seeing attractive prices and quickly driving the market back up.
In reality, a mass liquidation zone isn’t a final destination for price — it’s a starting point for rapid and often unpredictable moves.
If you, like me, prefer not to trust centralized exchanges, you’d probably want to swap your USDT for BTC somewhere safer. Instead of sending your funds to an exchange, you can simply use rabbit.io, where you don’t need to register an account, and your Bitcoin will be sent directly to your own wallet.
If you plan to swap during a period of high volatility — for example, when mass liquidations are underway and the market is highly unstable — here’s an important tip: Always choose the fixed-rate option for your swap.
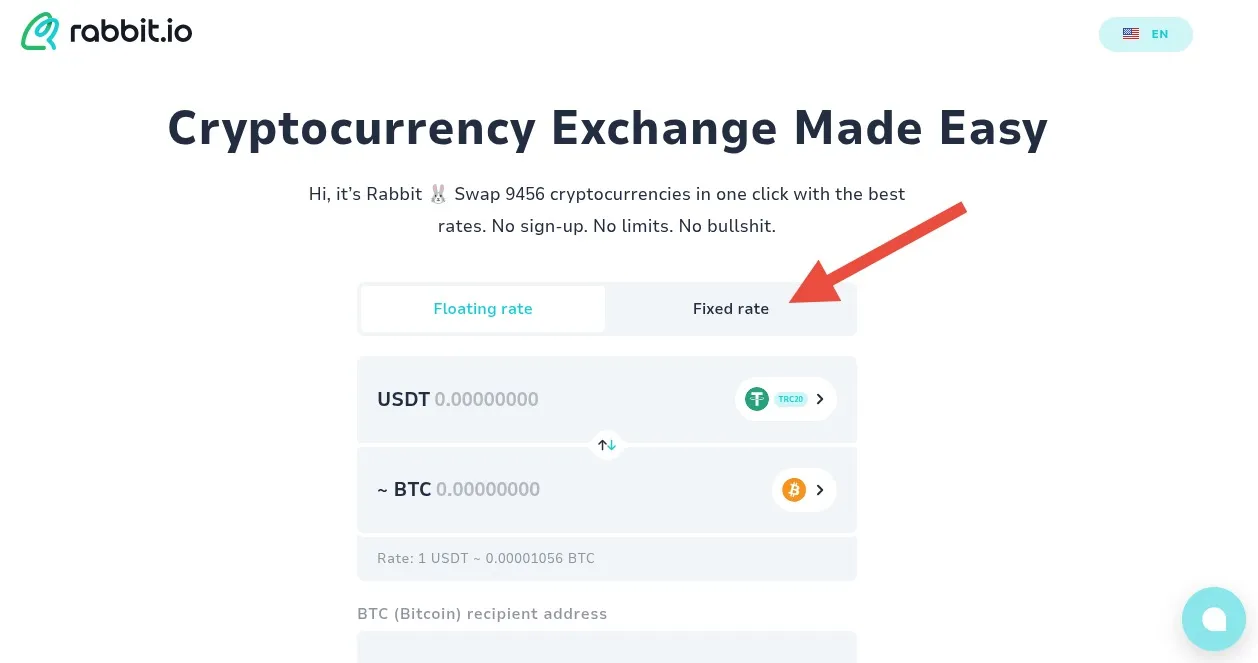
By default, rabbit.io offers floating-rate exchanges. This means that the final rate for your swap is determined at the moment your crypto arrives, not at the moment you create the swap request. During periods of extreme volatility, the rate can change dramatically between those two points, sometimes not in your favor.
When you select a fixed rate, you lock in the exchange rate at the moment you submit your request, protecting yourself from unexpected market swings. This can make a big difference when markets are moving fast.
Why Liquidation Hunting Isn’t as Simple as It Sounds
All the analytics companies that publish liquidation maps — whether it’s Coinglass, CoinAnk, or even the paid service Hyblock — rely on estimates and assumptions. None of them, not even the best, has exact data on where mass liquidations will happen.
In fact, even exchanges themselves don’t have perfect information. They certainly have more data than outside observers — at least they know the collateral backing each open position. But I highly doubt any exchange would ever share that information with Coinglass or anyone else.
There are two major reasons why:
- First, that data could easily be used against the exchange’s own clients.
- Second, if an exchange were unethical (and not worried about client loyalty), it could exploit that information for its own benefit — “hunting” its customers’ positions directly.
In either case, exchanges have every reason not to disclose where mass liquidations are most likely to occur.
And even exchanges themselves can’t predict exactly what each trader will do as the price approaches their liquidation level:
- Some traders will sit tight and let themselves get liquidated.
- Some will add collateral, pushing their liquidation price further away.
- Some will close their positions early (partially or fully), or even open opposite positions to profit from the developing market movement.
So even exchanges can only guess where mass liquidations might cluster. While third-party companies without insider information can only build their liquidation maps based on approximations and rough models.
For a whale to successfully “hunt” liquidations based on a heatmap, they need to move the market with huge market orders. But what if no forced liquidations actually happen where they expect? That would mean the whale’s market order has no “chain reaction” effect — and they end up selling high, buying very little back, and sitting on a loss.
If the whale guesses wrong about where the real liquidation pressure is, they lose money. Big money.
But What About On-Chain Platforms?
In recent years, we’ve seen the rise of trading platforms that offer leveraged trading while recording all relevant data directly on the blockchain — not just open position sizes, but also the collateral backing each one. Thanks to this transparency, anyone can calculate exactly at what price level each position would be liquidated.
Platforms like Hyperliquid, Injective Protocol, and Hubble Exchange operate with this full on-chain visibility. Everything is transparent: the open interest, the collateral, and the liquidation thresholds. But even this doesn’t eliminate the problem: traders whose positions are close to liquidation can still add more collateral or close out their trades early.
Take a real-world example.
On March 16, 2025, a trader on Hyperliquid opened a massive Bitcoin short position worth around $376 million, using 40x leverage. This position caught the attention of a well-known trader known as CBB, who publicly called on others to join forces and push Bitcoin’s price higher, triggering a forced liquidation of the whale’s position.
A wave of coordinated buying did cause Bitcoin’s price to rise, and the whale was forced to react — injecting an additional $5 million in USDC to shore up their collateral and avoid liquidation. In the end, the whale survived, Bitcoin’s price later retraced, and the would-be liquidation hunters were left empty-handed — or more precisely, stuck with losses.
Even on fully transparent platforms, liquidation hunting is extremely difficult. As this real-world example shows, even an organized group of traders trying to force a liquidation can end up failing.
So, Is Liquidation Hunting Completely Inefficient?
At the beginning of this article, I called liquidation hunting a myth. More precisely, what’s a myth is the idea that information about mass liquidation zones is reliably accessible and easily exploitable.
Even on fully transparent on-chain platforms, where you can see the expected liquidation price for each individual position, traders can easily shift those thresholds by adding more collateral or reducing their exposure. And on traditional centralized exchanges, where everything is hidden, trying to predict liquidations becomes even more uncertain.
That said, liquidation hunting is possible — but it’s often inefficient. It tends to require massive effort, perfect timing, and a lot of luck — and even then, success isn’t guaranteed. It’s not the easy money that some traders imagine.
In fact, liquidation hunting proves to be far more effective not in margin trading on exchanges, but in DeFi lending protocols.
Think back to the liquidation cascades we’ve seen on platforms like MakerDAO. When the price of ETH drops, undercollateralized loans are liquidated en masse, and those liquidation thresholds are publicly known in advance. Some traders have successfully profited by snapping up discounted collateral during these events — without needing to gamble on price manipulation.
There are even academic studies, such as “An Empirical Study of DeFi Liquidations: Incentives, Risks, and Instabilities”, showing how DeFi’s design sometimes encourages third parties to trigger liquidations for profit.
In short:
- Liquidation hunting exists — but it’s rarely efficient.
- It’s not something that easily happens in margin trading on exchanges.
- It’s something that plays out more predictably in DeFi, where buying discounted collateral after liquidations can actually be a smart and structured strategy.