


Can You Really Trust the Crypto Fear & Greed Index?
Fear and greed are the two dominant emotions driving any financial market — and crypto is no exception. When fear takes over, investors rush to sell off falling assets in panic, terrified of further losses. When greed kicks in, they start blindly buying whatever is rising, afraid to miss out on more profit. These psychological patterns have long been observed by economists and traders alike. Warren Buffett famously captured the idea with his maxim: “Be fearful when others are greedy, and greedy when others are fearful.”
To quantify these emotional swings, the crypto world has its own version of the Fear & Greed Index, originally created by the team at Alternative.me. It’s frequently cited in crypto media and social feeds.
In September 2024, just before Bitcoin doubled in price, the index was deep in the “extreme fear” zone. But back in summer 2022, it showed the same “extreme fear” for nearly a month — and Bitcoin didn’t rally. It dropped another 50% over the next six months.
What does that tell us? That the index was wrong? Or that fear and greed alone aren’t enough to predict price action? I believe understanding market sentiment is essential — but how exactly is that sentiment measured?
How the Fear & Greed Index Measures Sentiment
The developers of the Fear & Greed Index at Alternative.me rely on five key inputs to determine where the crypto market stands emotionally:
- Volatility: A sudden increase in volatility is interpreted as a sign of anxiety and fear.
- Market volume and momentum: Heavy buying activity during an uptrend is seen as a sign of greed, while a sharp price drop accompanied by high selling volume suggests panic and fear.
- Social media activity, especially on X: A spike in high-engagement, overly optimistic crypto content is viewed as greed. In contrast, a surge in pessimistic or fearful posts indicates rising fear in the market.
- Bitcoin dominance: When BTC’s share of the total crypto market cap increases, it suggests a flight to safety — a signal of fear. When its dominance drops, it’s interpreted as traders seeking higher yields in altcoins — a sign of greed.
- Google search trends: A jump in searches like “buy bitcoin” or “bitcoin bull run,” or increased interest in positive crypto news, points to greed. Rising searches for “bitcoin crash” or “sell bitcoin,” and greater attention to negative headlines, point to fear.
Is it just me, or do some of these indicators feel a bit… forced? Like they’re trying to retroactively assign emotions to market behavior?
Volatility
Volatility is often cited as a sign of market fear. When price swings become more extreme, the assumption is that traders are panicking — rushing to sell, unsure of what’s coming next. That’s why a spike in volatility is typically interpreted by the index as an indicator of growing anxiety.
But is that always true?
In crypto, volatility isn’t always emotional. Sometimes it’s purely mechanical. For example, cascading liquidations can drive price swings without any active decision-making at all. When traders get forcefully closed out of losing long positions, their assets are dumped onto the market — pushing prices lower. The lower the price falls, the more liquidation thresholds are triggered, fueling a chain reaction of automatic selling. Volatility increases sharply, but it’s not necessarily panic-driven. It’s algorithmic.
So yes, volatility can reflect fear. But not all volatility is fear — and assuming otherwise oversimplifies the market’s behavior.
Buy Volume, Sell Volume
Every trade has two sides: a buyer and a seller. For every coin sold, someone else has to buy it. So when we talk about “high buy volume” or “high sell volume,” we’re really describing the same event from two perspectives.
On exchanges, however, there’s a distinction that helps us interpret intent: the difference between makers and takers.
- A maker places a passive order — they’re willing to wait for someone to accept their price.
- A taker is more aggressive — they want the trade now and are willing to accept the current market price.
That difference matters.
If takers are aggressively selling into the order book during a price drop, that suggests fear — they’re afraid the price will fall further and want out fast. If, during a price rally, takers are piling in with market buys, that looks like greed — they’re chasing the pump, afraid to miss out.
Earlier this week, Bitcoin was trending down for several days. Yet on Bybit, takers continued to buy, even as the price declined.
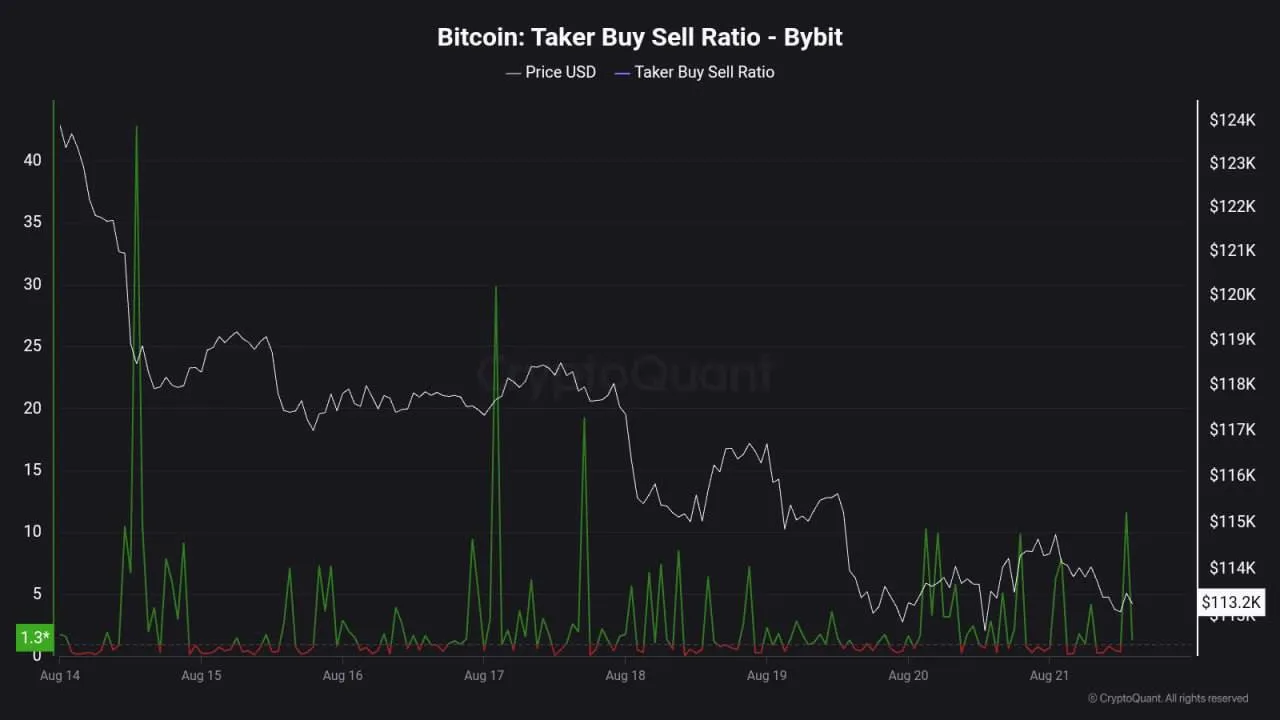
A chart from CryptoQuant showed that these traders weren’t panic-selling — quite the opposite. They saw the lower prices as a buying opportunity. That’s not fear — that’s confidence, maybe even greed.
Yes, it’s a sensible metric. But takers only make up half the market. What about the other side of those trades — the makers? We have no insight into their emotional state. For every aggressive buyer, there’s a seller willing to accept the price. Was that seller scared? Strategic? Indifferent? We don’t know.
And in crypto, many trades aren’t even denominated in fiat. Instead, we often see one crypto swapped for another — something I see all the time on rabbit.io.
So what happens when someone swaps Monero for ETH or SOL on rabbit.io after bullish macro news? Is that fear — selling a weakening XMR? Or greed — buying into ETH and SOL as they surge? It depends on your framing. Every trade tells two stories.
Social Media and Search Trends
Analyzing sentiment on platforms like X — post volume, tone, engagement — can offer a glimpse into the mood of the crypto community. The same goes for search engine data.
Sounds reasonable — but let’s think about whose emotions we’re measuring.
When we analyze taker behavior on exchanges, we’re looking directly at the actions of traders — people actually buying and selling crypto in real time. But when we analyze social media posts or Google Trends, we’re mostly measuring the audience. People posting, clicking, or searching may not be traders at all.
Plenty of people discuss crypto online without ever making a trade. Some are spectators. Some are bots. Some are just curious.
That means social and search sentiment might reflect the mood of the public, but not necessarily the mood of the market. In many cases, it’s just background noise — disconnected from real capital flows.
Bitcoin Dominance
The idea behind using Bitcoin dominance as a fear-versus-greed indicator comes from traditional finance. In CNN’s original Fear & Greed Index for stock markets, one component tracks demand for “safe haven” assets like U.S. Treasury bonds. When investors rush into bonds and away from stocks, it’s seen as a signal of fear. The spread between low-risk and high-risk bonds widens. When that spread narrows — and investors favor risky assets — it’s seen as a sign of greed.
In traditional markets, that framework makes sense. But can we apply it directly to crypto?
Many crypto indexes assume Bitcoin is the crypto equivalent of a Treasury bond — the “safe” asset in times of uncertainty. When BTC dominance rises, it’s taken as a sign that traders are retreating from risky altcoins. When it falls, it supposedly reflects increased appetite for risk and higher yield — a sign of greed.
But is Bitcoin really the crypto safe haven?
In practice, stablecoins (like USDT or USDC) now play that role more clearly. When fear peaks, traders don’t necessarily rush into Bitcoin — they often run straight into stablecoins, especially if they’re planning to wait out volatility or deploy capital into DeFi strategies with modest, predictable returns.
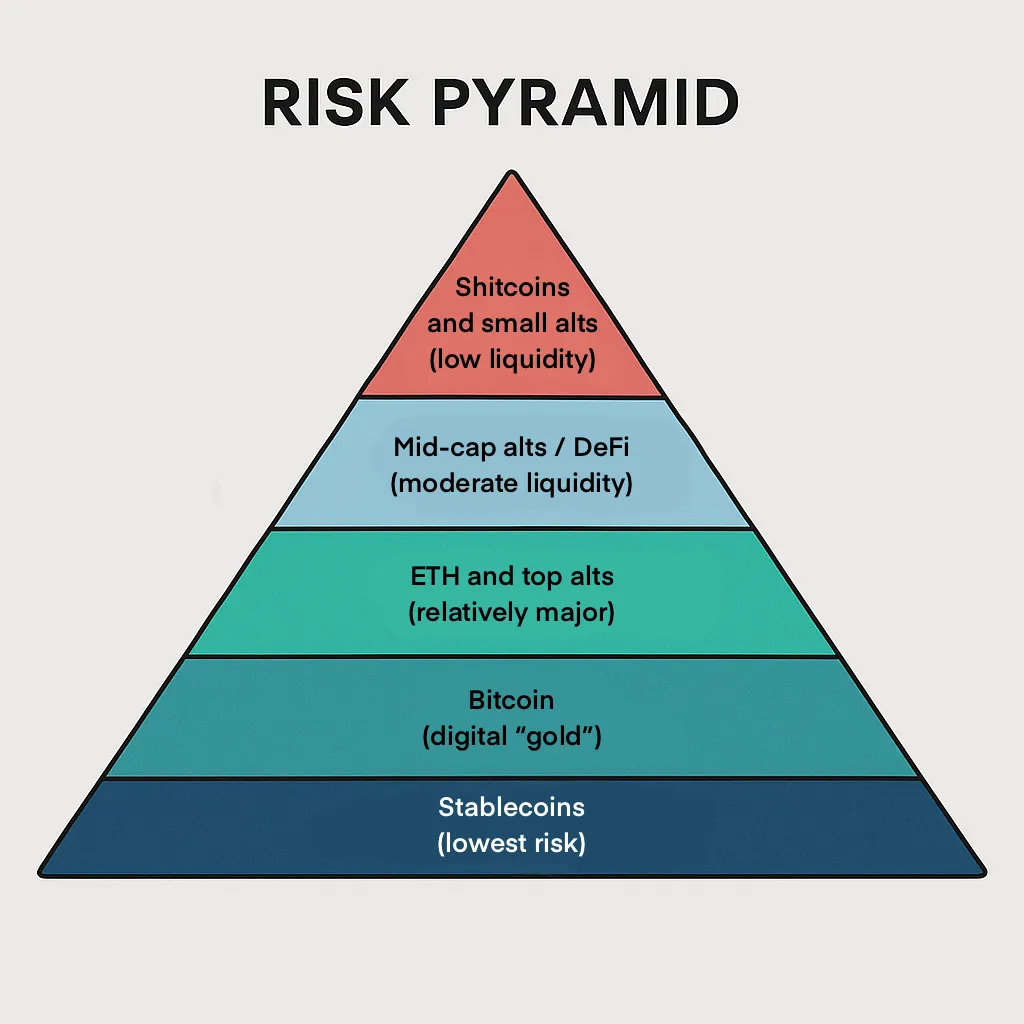
So maybe the true crypto risk pyramid looks a little different.
Instead of Bitcoin at the bottom, maybe stablecoins are the new base layer of “safety.” Bitcoin is still relatively conservative compared to altcoins — but treating it as the universal refuge in times of fear might be an oversimplification.
So, What Does It All Mean?
Even the most popular crypto Fear & Greed Index — the one from Alternative.me — is built on a foundation of assumptions. Its methodology raises plenty of questions, and a closer look reveals just how subjective many of its signals are.
And it’s not alone. Other platforms — like BitDegree, BTCtools, Alpha Data Analytics, and MilkRoad — each offer their own version of a sentiment index, using different formulas (some of which aren’t even publicly disclosed). If you’re going to rely on one of them, you should first ask yourself: Do I agree with how they define fear and greed?
That said, the idea behind these indexes isn’t useless. If you find yourself gripped by an overwhelming urge to buy or sell, checking a sentiment index might help you take a step back and reassess. Maybe you’re not reacting to market fundamentals at all — maybe you’re just absorbing the emotional energy of the crowd. And as Warren Buffett famously advised: that’s not always the best idea.
Still, these indexes shouldn’t be blindly followed — especially not as standalone contrarian indicators. If you don’t understand how they’re built, or you disagree with the logic behind them, then using them to time the market could do more harm than good.