


M2 leads, BTC follows - with a perfect 10-week delay
In 2024 and 2025, the correlation between global money supply (M2) and Bitcoin’s price has been almost perfect – with a 10-week delay.
If you shift the M2 chart 10 weeks forward and overlay it with the BTC price, the alignment is uncanny. Every surge in M2 is followed by a Bitcoin rally exactly 10 weeks later. Every pause in M2 growth? Bitcoin also stalls – again, after 10 weeks.
This pattern wasn’t as precise before 2024, but now it’s spot on.
Why is this happening? Most likely, large players see Bitcoin as a hedge against inflation, which shows up in M2 expansion. And it takes about 10 weeks for that new liquidity to reach the hands of those who are ready to deploy it into BTC.
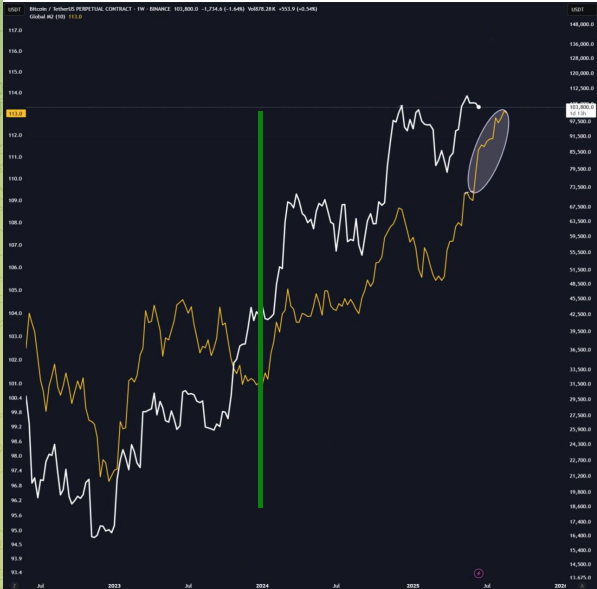
In the chart:
- The white line is Bitcoin’s price.
- The yellow line is M2, shifted 10 weeks forward.
- The green vertical line marks the moment the correlation turned near-perfect.
- The white ellipse shows M2 data from the past 10 weeks – and if the pattern holds, it tells us where Bitcoin could be heading next.
So what’s the forecast? If wars and black swan events don’t get in the way, we might be looking at a new ATH in July.
Wanna test the theory? Let’s meet back here in exactly 10 weeks.
Oh – and one more thing. Notice the BTC price in the chart is in USDT, not USD. Just a little hint: you don’t have to wait 10 weeks to swap your USDT for BTC 😉
Where to swap? On rabbit.io, of course.