


Bitcoin's 3-Up-1-Down "Pattern": Broken or Just Misread?
Market commentators kept repeating a popular idea this year: since 2011, Bitcoin tends to follow a clear pattern - three positive years, one negative year. If we extended that logic to 2025, the expectation would be a green year.
Now the year is ending, and the yearly change is red. So... is the long-standing pattern officially broken?
The thing is, 2011 and 2012 candles can look completely different depending on where you pull the data from. Back then, nobody calculated an average market price (CoinDesk only launched its first-ever index in 2013). Each exchange had its own price, its own volatility, its own "truth".
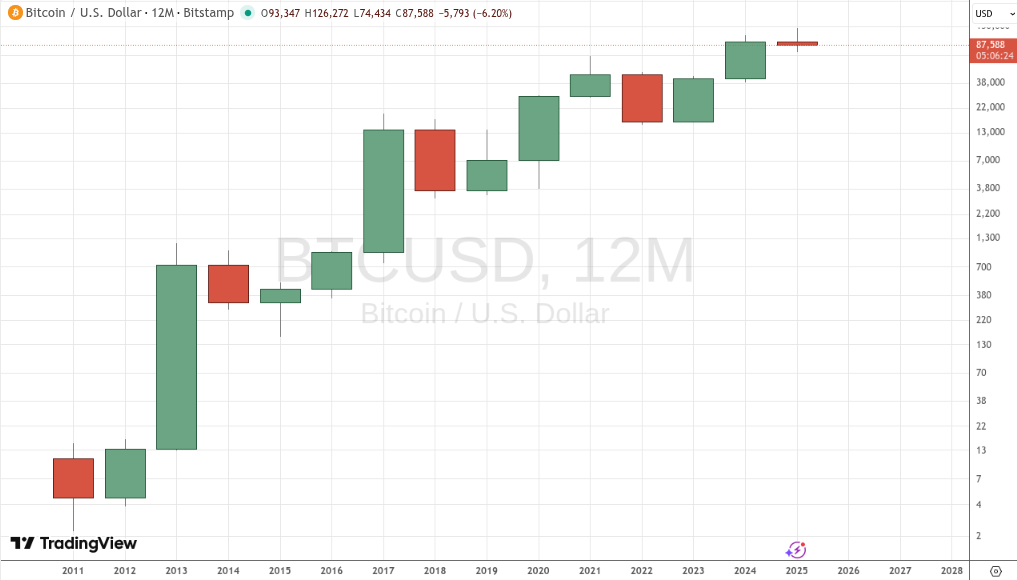
For example, on the BTCUSD chart from Bitstamp, 2011 closes as a bearish candle. With that version, the pattern becomes:
-++-+++-+++-++-
So the cycle didn’t break. It simply ended. And next year might bring something totally new - the kind of twist no one could have predicted.
Happy New Year! Wishing you exciting surprises - and of course, fast and smooth swaps on Rabbit.io!